Meeting at the bar
02 April, 2014
Introduction
Hi everybody ! This post is more or less the continuation of my previous one: Home, sweet home. We will take desktop customisations a little further here, so I'll assume that you, the reader, know the base of linux system administration.
Status bar can display anything you feed them with, so let's make that food useful to us. We will learn how to display system informations on your screen.
Here we go!
Summary
head-up display
First of all, let's understand what an HUD is. Gamers can go to the next paragraph. An HUD display some information you (most of the time) wants to see. In video-games, that will be your life/armor points, or the number of ammos loaded in your gun. Those informations are almost always visible and are updated in real-time.
But we're not playing video games here. And you're probably not reading with a
loaded gun in your hand. So, sitting in front of your computer, you want other
kind of informations. We will talk about those informations later.
First, let's see HOW we will display them on-screen. I currently know 4 ways of
doing it (understand, I've not tried the alternatives):
- dzen
- conky
- tmux
- bar
dzen
From the official website:
Dzen is a general purpose messaging, notification and menuing program for X11. It was designed to be scriptable in any language and integrate well with window managers like dwm, wmii and xmonad though it will work with any windowmanger.
Seems great ! Dzen is really simple to use, pipe text to it, and watch it appear on your screen:
echo shblah | dzen2 -w 120 -x 10 -y 10 -p 5
I'm not a huge fan of dzen anymore. I used to be (You can do awesome things with dzen, just check earsplit's dekstop, but I discovered a new tool that is basically dzen simplified, and written on top of XCB (see the fourth alternative: bar).
conky
Here comes the king of HUDs, ladies and gentlemen, please put a knee to the
ground!
Conky's job is to display every possible information on your screen, in a really
eye-candy way. I made
this, monthes ago
using conky (do not ask for configs or wallpaper, I don't have them anymore).
It is extensible in lua and has a heavy set of features built-in. Check this out: conky's variables I've been using conky for weeks, but I just got bored. I realised that I did not need so much infos in real-time. But that was a fun period !
Conky reads its configuration from the ~/.conkyrc file. A minimalist config
would be:
cat <<EOF > ~/.conkyrc
alignment tl
gap_x 10
gap_y 40

TEXT
shblah
EOF
conky &
But for such a simple thing, that's a bit overkill.
Note that there is also conky-cli that outputs informations to stdout. That is
useful to build informations lines to feed a bar with. To have a quick idea of
how this works, check this
nice forum post by jmbi.
tmux statusbar
This one is a bit out of competition, but worth mentionning. TMux stands for terminal multiplexer. Short story, you can have multiple terminal within a single terminal window. But it offers a nice feature: a status bar, that is displayed at the bottom of the window. You can run any command in here, or even shell scripts, and the output will sit just there.
Tmux actually have a left and right status bar. So just pick one (or both) to display some infos:
echo "set-option -g status-left "shblah" >> ~/.tmux.conf
tmux
Phyrne wrote a nice article about it. Just read it.
bar
My last and prefered option, the bar made by LemonBoy !
This small piece of software is a stripped down clone of dzen, written on top
of XCB (a better librairy to communicate with the X server). It's fast, it's
light and you can even script it, as it now has a clickable item that you can
use to start applications. More infos here.
Bar is pretty easy to use. It works the same way dzen does, by piping text to it:
echo 'shblah' | bar -g 120x20+10+80 -p
Starting from now, I will use bar as my tool of choice, but use the one you prefer, they can all do such a thing (well, conky has pretty much everything done for you, but meh) !
fetching informations
Once you now which tool you'll use to display your informations, you need to decide which one you want. For the purpose of the article, I'll settle on 8 of them:
- current date / time
- battery level
- sound level
- CPU load
- RAM used
- network connection state
- window manager groups
- mpd's current playing song
I choosed those to show you many ways to fetch informations on your computer.
Before going any further, I need to introduce you to the tools we'll need, and that we just CAN'T avoid to fetch informations..
awk-- a powerfull script language, I don't know enough about this, thoughcut-- cut a string in small parts, and pick some parts of itgrep-- should I really present 'grep' ?sed-- stream editor, it's useful to format outputstest-- test an expression and return 0 if it's true, >0 otherwisetr-- translate or delete characters from the input
By the way, that would be a HUGE plus to know about regular
expressions, because we are
going to use them a lot with sed.
So, here we go!
current date / time
There is nothing hard with it. The date utility has a parameter to format its
output. So we'll just use that:
date '+%Y-%m-%d %H:%M' # print current date and time: yyyy-mm-dd HH:MM
battery level
There is this tool, acpi that can be used to output some infos on your system
power. But that's just not fun! We'll be messing with the /sys directory
instead, which is a goldmine. Feel free to navigate it, to see what you can
find.
Back to the battery. We are interested in two information, the current charge of the battery (in percent) and if the charger is plugged in, or not. on my system (because it may be different on yours), I have those two files:
/sys/class/power_supply/BAT1/capacity   # contains a value from 0 to 100
/sys/class/power_supply/BAT1/status     # either "Charging" or "Discharging"
We will then be able to output the battery level, and do some action, depending on the battery state. To get the info:
BATC=/sys/class/power_supply/BAT1/capacity
BATS=/sys/class/power_supply/BAT1/status

# prepend percentage with a '+' if charging, '-' otherwise
test "`cat $BATS`" = "Charging" && echo -n '+' || echo -n '-'

# print out the content (forced myself to use `sed` :P)
sed -n p $BATC
sound level
This one is always a pain.. I will assume that you use ALSA as your sound system (because I have no idea how OSS or PulseAudio works).
First, you need to know which channel your want to watch. Most of the time,
'Master' is a good choice. I personnally use alsamixer to navigate between the
channels to see what they are related to. The alsa-utils packages (name may
vary depending on the distribution) contains a utility named amixer to
interact with the system. The special command amixer get <CONTROL> is used to
query informations about a channel. But the output is awful to look at, so we'll
need to format it. Example output:
───── amixer get Master
Simple mixer control 'Master',0
Capabilities: pvolume pvolume-joined pswitch pswitch-joined
Playback channels: Mono
Limits: Playback 0 - 64
Mono: Playback 53 [84%] [-10.00dB] [on]
You can notice that the info we're interested in sits at the end of the output. That will make things easier.
# parse amixer output to get ONLY the level. Will output "84%"
# we need `uniq` because on some hardware, The master is listed twice in
# "Front Left" and Front Right" (because laptop speakers I guess)
amixer get Master | sed -n 's/^.*\[\([0-9]\+\)%.*$/\1/p'| uniq
CPU load
There are many way to get the current CPU load. iostat is one of them, and as
it's easy to parse its output, i'll go with a trickier approach, using ps and
bc.
To get the current CPU load used by every program, one can use this command:
# gives you the CPU load used by every running program
# 'args' is used here just so you can see the programs command lines

ps -eo pcpu,args
We don't care about idling programs that uses '0.0' load or the header '%CPU',
so we can just remove them with grep -vE '^\s*(0.0|%CPU)'.
ps -eo pcpu | grep -vE '^\s*(0.0|%CPU)'
We now have a list of the CPU loads actually used, but per program. We just need
to sum them up!
The problem is: bash CAN'T perform floating point operations. And thus, we
will need the help of the great bc to do so (if you don't have this installed,
I recommend that you just get it right away!).
bc takes operations from stdin, and outputs to stdout. Pretty simple. Pretty
good.
Thanks to
randomcrocodile
for pointing out the two digit problem (and other things)
# use the "here-line" feature.
# The whole line goes to bc which outputs the result

LINE=`ps -eo pcpu |grep -vE '^\s*(0.0|%CPU)' |sed -n '1h;$!H;$g;s/\n/ +/gp'`
bc <<< $LINE
NOTE: verkgw on irc.blinkenshell.org proposed a faster awk alternative.
I don't know awk enough to come up with this kind of line, so I'll just continue
with grep and sed. See the comparison here
ps -eo pcpu | awk 'BEGIN {sum=0.0f} {sum+=$1} END {print sum}'
RAM used
To display RAM usage (percentage of RAM actually by the system), we will use
another place of the filesystem: /proc. This will be easier to find memory
usage here, than battery level in /sys:
───── ls /proc/ | grep 'mem'
iomem
meminfo
If you take a quick look at iomem, you'll understand that it's NOT the
file we want here (I don't understand a bit of it)! Instead, let's take a look
at meminfo:
───── sed 8q /proc/meminfo
MemTotal:        2748648 kB
MemFree:         2209672 kB
Buffers:           34016 kB
Cached:           270728 kB
SwapCached:            0 kB
Active:           182292 kB
Inactive:         272636 kB
Active(anon):     150948 kB
Good, good, exactly the information we want! So let's just extract them, using
awk to fetch ONLY the column containing the value (Yeah, that's why I use
awk for mostly. I'll need to dive a little more in that language):
───── grep -E 'Mem(Total|Free)' /proc/meminfo |awk '{print $2}'
2748648
2204288
At this point, you might realise that those two number are not really useful. We will need to modify them a little by converting them to Mib, and making a ratio out of them. A neat alternative would be to ignore cached memory and buffers, to know exactly how much the applications are taking:
# store the total and free memory in two variables
read t f <<< `grep -E 'Mem(Total|Free)' /proc/meminfo |awk '{print $2}'`
read b c <<< `grep -E '^(Buffers|Cached)' /proc/meminfo |awk '{print $2}'`

# then, calcultate the percentage of memory used
bc <<< "100($t -$f -$c -$b) / $t"
network connection state
Mmh, this one can be tricky! Ther are two cases here:
- You have one interface
- You have more than one interface
The first one is quite simple: use your interface name directly, and skip the following section.
Now what if you have, let's say two interfaces: ethernet, and wifi. Let's find
out HOW to get the currently used.
We will need two tools for that: ip (from iproute2) and iwconfig (from
wireless_tools). We will get the interfaces with ip, and recognize the wifi
interface using iwconfig. Sounds easy huh ?
# The following assumes you have 3 interfaces: loopback, ethernet, wifi
read lo int1 int2 <<< `ip link | sed -n 's/^[0-9]: \(.*\):.*$/\1/p'`

# iwconfig returns an error code if the interface tested has no wireless
# extensions
if iwconfig $int1 >/dev/null 2>&1; then
    wifi=$int1
    eth0=$int2
else
    wifi=$int2
    eth0=$int1
fi

# in case you have only one interface, just set it here:
# int=eth0

# this line will set the variable $int to $eth0 if it's up, and $wifi
# otherwise. I assume that if ethernet is UP, then it has priority over
# wifi. If you have a better idea, please share :)
ip link show $eth0 | grep 'state UP' >/dev/null && int=$eth0 || int=$wifi
This is now the time to see if network is up or not. For that, a simple ping
would do the trick:
# just output the interface name. Could obviously be done in the 'ping'
# query
echo -n "$int"

# Send a single packet, to speed up the test. I use google's DNS 8.8.8.8,
# but feel free to use any ip address you want. Be sure to put an IP, not a
# domain name. You'll bypass the DNS resolution that can take some precious
# miliseconds ;)
ping -c 1 8.8.8.8 >/dev/null 2>&1 && echo "connected" || echo "disconnected"
window manager groups
Aaah, the information that has the most way to be fetched! The problem with
this, is that every window manager provide a different way to fetch the number
of workspaces, and the current one. If you're lucky, and that your WM is
EWMH compliant, xprop will be the way to
go. For the others, you will need to find a proper way on your own. For exemple,
to get the number of groups and the current group with ratpoison:
echo "`ratpoison -c groups| cut -sd'*' -f1`/`ratpoison -c groups| wc -l`"
Back to the topic, fetching current group out of all the groups. To make this a
little more exiting, we will output something like "==|=====", '|' being the
current desktop, '=' being the other desktops.
The first step is to fetch the number of desktops, and the index of the current
one. To do that, let's use xprop
cur=`xprop -root _NET_CURRENT_DESKTOP | awk '{print $3}'
tot=`xprop -root _NET_NUMBER_OF_DESKTOPS | awk '{print $3}'
If that enough for you, you can obviously just output $cur/$tot ;)
But now, the desktop indicator. To do that, there is two solutions:
- cicle through all the groups and output either '=' or '|'
- ouput the correct number of '|' before and after '|'
I tried both versions, and time reports that they are they're almost the
same:
───── time cicle.sh
==|=======

real    0m0.025s
user    0m0.013s
system  0m0.000s

───── time fillup.sh
==|=======

real    0m0.020s
user    0m00m0.013s
system  0m0.000s
We will then use the 'fillup' one. To improve performances, we will first fill a variable with the 'group line', and then output it. It goes like this:
# Desktop numbers start at 0. if you want desktop 2 to be in second place,
# start counting from 1 instead of 0. But wou'll lose a group ;)
for w in `seq 0 $((cur - 1))`; do line="${line}="; done

# enough =, let's print the current desktop
line="${line}|"

# En then the other groups
for w in `seq $((cur + 2)) $tot`; do line="${line}="; done

# don't forget to print that line!
echo $line
mpd's current playing song
After all that we did alredy, printing the current playing should bequite easy as:
cur=`mpc current`
test -n "$cur" && echo $cur || echo "- stopped -"
Easy isn't it ? So let's add some difficulties to it. What if you have only 120
pixels to display that ?
Aaaah trickyer isn't it ?
Don't worry, I wrote a small tool for that: skroll. You can see it in action here.
So now, our output has just become:
cur=`mpc current`
test -n "$cur" && echo $cur |skroll -n 20 -d0.5 -r || echo "- stopped -"
A small drawback with this approach: you can't put other infos in the same bar
as a skrolling output, because it uses a \n or a \r to print the output.
wrap it all !
Now that we have a whole bunch of informations, it's time to put them all in a script, that we will pipe later to our HUD.
#!/bin/sh
#
# z3bra - (c) wtfpl 2014
# Fetch infos on your computer, and print them to stdout every second.

clock() {
    date '+%Y-%m-%d %H:%M'
}

battery() {
    BATC=/sys/class/power_supply/BAT1/capacity
    BATS=/sys/class/power_supply/BAT1/status

    test "`cat $BATS`" = "Charging" && echo -n '+' || echo -n '-'

    sed -n p $BATC
}

volume() {
    amixer get Master | sed -n 'N;s/^.*\[\([0-9]\+%\).*$/\1/p'
}

cpuload() {
    LINE=`ps -eo pcpu |grep -vE '^\s*(0.0|%CPU)' |sed -n '1h;$!H;$g;s/\n/ +/gp'`
    bc <<< $LINE
}

memused() {
    read t f <<< `grep -E 'Mem(Total|Free)' /proc/meminfo |awk '{print $2}'`
    bc <<< "scale=2; 100 - $f / $t * 100" | cut -d. -f1
}

network() {
    read lo int1 int2 <<< `ip link | sed -n 's/^[0-9]: \(.*\):.*$/\1/p'`
    if iwconfig $int1 >/dev/null 2>&1; then
        wifi=$int1
        eth0=$int2
    else
        wifi=$int2
        eth0=$int1
    fi
    ip link show $eth0 | grep 'state UP' >/dev/null && int=$eth0 ||int=$wifi

    #int=eth0

    ping -c 1 8.8.8.8 >/dev/null 2>&1 &&
        echo "$int connected" || echo "$int disconnected"
}

groups() {
    cur=`xprop -root _NET_CURRENT_DESKTOP | awk '{print $3}'`
    tot=`xprop -root _NET_NUMBER_OF_DESKTOPS | awk '{print $3}'`

    for w in `seq 0 $((cur - 1))`; do line="${line}="; done
    line="${line}|"
    for w in `seq $((cur + 2)) $tot`; do line="${line}="; done
    echo $line
}

nowplaying() {
    cur=`mpc current`
    # this line allow to choose whether the output will scroll or not
    test "$1" = "scroll" && PARSER='skroll -n20 -d0.5 -r' || PARSER='cat'
    test -n "$cur" && $PARSER <<< $cur || echo "- stopped -"
}

# This loop will fill a buffer with our infos, and output it to stdout.
while :; do
    buf=""
    buf="${buf} [$(groups)]   --  "
    buf="${buf} CLK: $(clock) -"
    buf="${buf} NET: $(network) -"
    buf="${buf} CPU: $(cpuload)%% -"
    buf="${buf} RAM: $(memused)%% -"
    buf="${buf} VOL: $(volume)%%"
    buf="${buf} MPD: $(nowplaying)"

    echo $buf
    # use `nowplaying scroll` to get a scrolling output!
    sleep 1 # The HUD will be updated every second
done
All you have to do now is to pipe this script to your status bar of choice:
./barmk.sh | bar.
There you are! You now know how (ow ow ow) make your system talk to you. Obviously, this is a raw script, and it can be heavily improved (eg, add some colors, parse CLI arguments, etc..).
But I'm pretty sure that it's a good start for your imagination. By the way, if you find neat tricks to improve the performances of the functions listed above, feel free to mail me these, I'll be glad to modify them!
 Before leaving you, here is what I got using this script
(with some tweaks, see the
Before leaving you, here is what I got using this script
(with some tweaks, see the diff output)
Oh, and for reference. It tried to get the same result
with conky and barmk, just to see the difference. Note how conky does not
display float numbers (for CPU). Also, I was not able to recreate a desktop bar with conky, so I "downgraded"
the barmk script to make the battle more fair.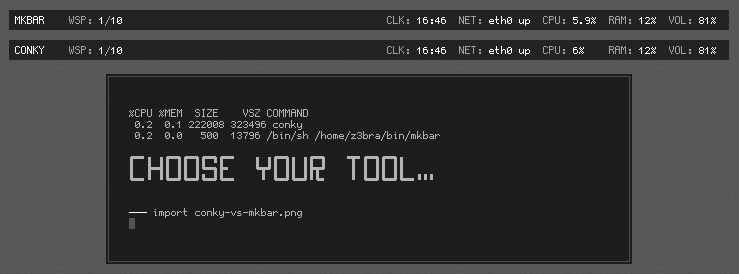
Now go ahead, and watch how your computer tell you how he (or she) feels... Isn't that amazing ?!